
The latest semi-annual USDA report (9 April 2026) confirms China’s emergence as a major poultry meat exporter, positions Brazil as the undisputed leader in global trade, and forecasts world production of 110.7 million tonnes in 2026
The United States Department of Agriculture (USDA) has published the semi-annual edition of its Livestock and Poultry: World Markets and Trade report, dated 9 April 2026. From its statistical tables, official forecasts for broiler meat production, consumption, imports and exports for the world’s leading countries can be derived, with data updated to 2025 and projections for 2026.
In this article, we provide an in-depth analysis — for the more than 5,000 monthly readers of NeXusAvicultura — of the poultry meat section, the most dynamic segment of the report, along with a brief summary of the beef and pork sections.
World production: 110.7 million tonnes in 2026
Global broiler meat production is forecast to reach 110.7 million tonnes (RTC) in 2026, 3% more than in 2025, according to USDA projections. This marks the third consecutive year of sustained growth, driven primarily by China and Brazil.
China leads the increase with projected output of 17.3 million tonnes (+5%), supported by high grandparent breeder inventories, expansion of large integrators, increased slaughter and processing capacity, and falling feed costs. Brazil will grow to 15.8 million tonnes (+2%), driven by export demand, a weak real, and competitive production costs. The EU will advance 1% to 12.3 million tonnes, contingent on a reduction in HPAI outbreaks. The USA will produce 22.2 million tonnes (+2%), the undisputed world leader, with higher live weights and positive margins.
| Broiler meat production – Major countries (1,000 MT RTC) | ||||||
| 2022 | 2023 | 2024 | 2025 | 2026 Dec | 2026 Apr | |
| Production | ||||||
| China | 14,300 | 14,800 | 15,350 | 16,500 | 16,700 | 17,300 |
| Brazil | 14,465 | 14,900 | 15,000 | 15,450 | 15,700 | 15,800 |
| European Union | 10,880 | 11,040 | 11,735 | 12,090 | 11,970 | 12,250 |
| Russia | 4,800 | 4,825 | 4,920 | 4,995 | 5,140 | 5,070 |
| Mexico | 3,763 | 3,888 | 3,990 | 4,153 | 4,150 | 4,285 |
| Thailand | 3,300 | 3,450 | 3,490 | 3,535 | 3,650 | 3,575 |
| Turkey | 2,418 | 2,329 | 2,512 | 2,797 | 2,900 | 2,910 |
| Argentina | 2,319 | 2,436 | 2,485 | 2,525 | 2,590 | 2,590 |
| Colombia | 1,893 | 1,890 | 1,895 | 2,074 | 2,090 | 2,150 |
| United Kingdom | 1,847 | 1,858 | 1,867 | 1,899 | 1,890 | 1,910 |
| Others | 21,310 | 21,321 | 19,812 | 20,194 | 20,805 | 20,698 |
| Subtotal | 81,295 | 82,737 | 83,056 | 86,212 | 87,585 | 88,538 |
| United States | 20,994 | 21,082 | 21,343 | 21,773 | 22,029 | 22,190 |
| World total | 102,289 | 103,819 | 104,399 | 107,985 | 109,614 | 110,728 |
| Total domestic consumption | ||||||
| China | 14,401 | 15,002 | 15,057 | 15,712 | 15,900 | 16,150 |
| European Union | 9,867 | 10,110 | 10,686 | 11,089 | 11,085 | 11,260 |
| Brazil | 10,023 | 10,135 | 10,110 | 10,485 | 10,455 | 10,655 |
| Mexico | 4,664 | 4,887 | 5,004 | 5,175 | 5,285 | 5,326 |
| Russia | 4,750 | 4,837 | 4,941 | 5,045 | 5,180 | 5,145 |
| Japan | 2,877 | 2,846 | 2,937 | 2,965 | 3,000 | 2,963 |
| United Kingdom | 2,484 | 2,569 | 2,605 | 2,706 | 2,730 | 2,750 |
| Philippines | 1,880 | 1,892 | 2,060 | 2,313 | 2,400 | 2,536 |
| Argentina | 2,138 | 2,298 | 2,317 | 2,397 | 2,490 | 2,485 |
| Turkey | 1,772 | 1,870 | 2,157 | 2,324 | 2,450 | 2,400 |
| Others | 27,340 | 27,169 | 25,743 | 26,152 | 26,927 | 26,629 |
| Subtotal | 82,196 | 83,615 | 83,617 | 86,363 | 87,902 | 88,299 |
| United States | 17,677 | 17,877 | 18,408 | 18,781 | 19,020 | 19,237 |
| World total | 99,873 | 101,492 | 102,025 | 105,144 | 106,922 | 107,536 |
| Note: Chicken feet excluded. Source: USDA-FAS, April 2026 | ||||||
“China will produce 17.3 million tonnes of chicken in 2026, significantly surpassing Brazil for the first time. The axis of production growth has shifted to the Asian giant.”
World trade: 14.8 million tonnes and a map in transformation
Global broiler meat exports will grow 3% to 14.8 million tonnes in 2026. However, the aggregate figure conceals a profound redistribution of export power.
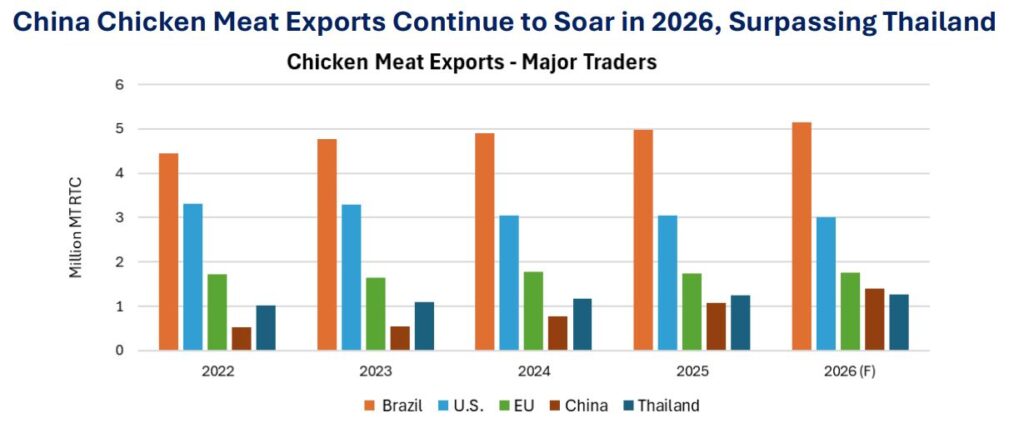
Broiler meat exports by major country (million MT RTC). Source: USDA-FAS, April 2026.
Brazil retains the lead with 5.15 million tonnes (35% of global trade), backed by its HPAI-free status, price competitiveness, product diversity, and the ability to redirect trade flows in response to instability in the Middle East. The USA ranks second with 3.015 million tonnes (20%), followed in third place by the EU with 1.75 million tonnes (12%), and, now as the fourth-largest global exporter, China with 1.4 million MT, followed by Thailand with 1.275 million tonnes.
| Global broiler meat trade share (%) | |||||
| Country | 2022 | 2023 | 2024 | 2025 | 2026 (F) |
| Brazil | 33% | 35% | 36% | 35% | 35% |
| USA | 24% | 24% | 22% | 21% | 20% |
| EU | 13% | 12% | 13% | 12% | 12% |
| China | 4% | 4% | 6% | 8% | 9% |
| Thailand | 8% | 8% | 9% | 9% | 9% |
| Others | 19% | 16% | 15% | 15% | 15% |
| Source: USDA-FAS, April 2026 | |||||
The USA stagnates at 3.0 million tonnes (20% of trade), weighed down by uncompetitive export prices, the loss of the Chinese market, HPAI-related restrictions in South Africa, and Brazilian competition in Mexico. Its share falls from 24% in 2022 to a projected 20% in 2026.
“Brazil and China are capturing virtually all of the growth in global chicken trade. For the remaining exporters — the EU, Thailand, Turkey, Ukraine — gains are marginal.”
| Broiler meat trade – Major countries (1,000 MT RTC) | ||||||
| 2022 | 2023 | 2024 | 2025 | 2026 Dec | 2026 Apr | |
| Imports | ||||||
| Japan | 1,101 | 1,063 | 1,143 | 1,122 | 1,170 | 1,130 |
| United Kingdom | 903 | 935 | 977 | 1,049 | 1,075 | 1,075 |
| Mexico | 915 | 1,006 | 1,021 | 1,031 | 1,140 | 1,050 |
| European Union | 701 | 722 | 723 | 743 | 840 | 760 |
| Philippines | 496 | 434 | 496 | 612 | 585 | 710 |
| Saudi Arabia | 594 | 564 | 607 | 586 | 655 | 525 |
| Iraq | 531 | 529 | 552 | 492 | 500 | 520 |
| Ghana | 253 | 277 | 331 | 394 | 410 | 425 |
| UAE | 356 | 375 | 385 | 400 | 415 | 375 |
| Russia | 200 | 232 | 285 | 325 | 275 | 350 |
| Others | 5,083 | 5,024 | 4,718 | 4,635 | 4,874 | 4,615 |
| Subtotal | 11,133 | 11,161 | 11,238 | 11,389 | 11,939 | 11,535 |
| United States | 83 | 61 | 70 | 70 | 64 | 60 |
| World total | 11,216 | 11,222 | 11,308 | 11,459 | 12,003 | 11,595 |
| Exports | ||||||
| Brazil | 4,447 | 4,767 | 4,895 | 4,970 | 5,250 | 5,150 |
| European Union | 1,714 | 1,652 | 1,772 | 1,744 | 1,725 | 1,750 |
| China | 532 | 554 | 770 | 1,085 | 1,200 | 1,400 |
| Thailand | 1,021 | 1,098 | 1,170 | 1,249 | 1,275 | 1,275 |
| Turkey | 646 | 459 | 355 | 473 | 450 | 510 |
| Ukraine | 419 | 428 | 463 | 451 | 475 | 460 |
| Russia | 245 | 220 | 264 | 275 | 235 | 275 |
| United Kingdom | 266 | 224 | 239 | 242 | 235 | 235 |
| Argentina | 194 | 144 | 175 | 153 | 135 | 125 |
| Canada | 112 | 114 | 121 | 107 | 120 | 115 |
| Others | 644 | 589 | 473 | 495 | 527 | 479 |
| Subtotal | 10,240 | 10,249 | 10,697 | 11,244 | 11,627 | 11,774 |
| United States | 3,314 | 3,291 | 3,040 | 3,047 | 3,066 | 3,015 |
| World total | 13,554 | 13,540 | 13,737 | 14,291 | 14,693 | 14,789 |
| Note: Chicken feet excluded. Source: USDA-FAS, April 2026 | ||||||
China: from net importer to export powerhouse in just two years
nnnnThe central chapter of the USDA report is dedicated to China’s transformation as a poultry meat exporter. The figures are compelling: Chinese exports reached 1,085,000 tonnes in 2025, up +41% compared to 2024, and the USDA forecasts they will rise to 1.4 million tonnes in 2026 (+29%). In 2020, China exported barely 388,000 tonnes. In six years, it has multiplied its exported volume by 3.6.
nnnnnnnnn«China has multiplied its chicken export volume by 3.6 in six years. No other country has altered the balance of global poultry trade at this speed.»
n
In value terms, Chinese chicken exports reached 2.59 billion dollars in 2025, almost double the 2020 figure. The competitive weapon is price: China offers low-cost chicken, penetrating the markets of developing countries in Asia, Africa and the Middle East. China became a net exporter in 2024 and exports will already represent 8% of its production in 2026, compared to 3% in 2020.
nnnn| China – Poultry Meat: Supply and Demand (1,000 MT) | |||||||
| 2020 | 2021 | 2022 | 2023 | 2024 | 2025 | 2026 (F) | |
| Production | 14,600 | 14,700 | 14,300 | 14,800 | 15,350 | 16,500 | 17,300 |
| Imports | 999 | 788 | 633 | 756 | 477 | 297 | 250 |
| Exports | 388 | 457 | 532 | 554 | 770 | 1,085 | 1,400 |
| Domestic consumption | 15,211 | 15,031 | 14,401 | 15,002 | 15,057 | 15,712 | 16,150 |
| Production chg. (%) | 6% | 1% | -3% | 3% | 4% | 7% | 5% |
| Import chg. (%) | 72% | -21% | -20% | 19% | -37% | -38% | -16% |
| Export chg. (%) | -9% | 18% | 16% | 4% | 39% | 41% | 29% |
| Imports / consumption (%) | 7% | 5% | 4% | 5% | 3% | 2% | 2% |
| Exports / production (%) | 3% | 3% | 4% | 4% | 5% | 7% | 8% |
| Source: USDA-FAS / Trade Data Monitor | |||||||
Radical diversification of destinations
nnnnIn 2020, Japan and Hong Kong accounted for 79% of Chinese chicken exports. In 2025, their combined share has fallen to 37%. Growth has been redirected towards Russia (11%), the EU (10%), Cambodia, Kyrgyzstan, Iraq, UAE and African markets.
nnnn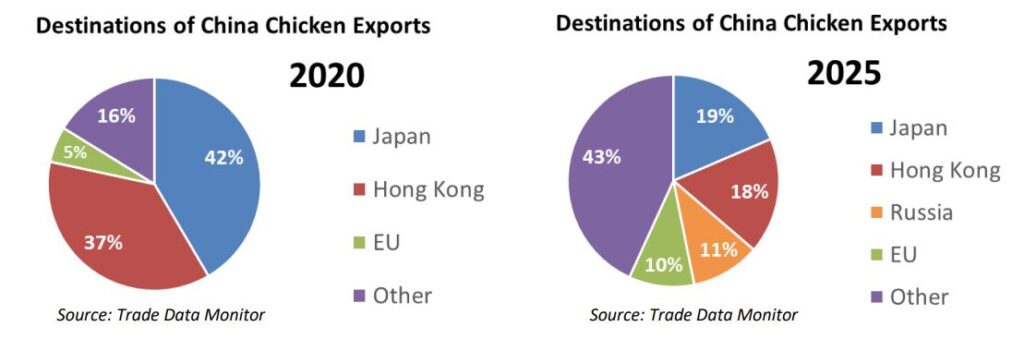
Destinations of Chinese chicken exports: 2020 vs. 2025 comparison. Source: Trade Data Monitor.
nnnnChinese chicken exports to Africa rose from barely 1,383 tonnes in 2020 to 65,289 tonnes in 2025 (+274% year-on-year). Iraq, practically non-existent as a destination in 2022, received 25,859 tonnes in 2025. Qatar went from zero to more than 10,000 tonnes.
Chinese chicken exports to Africa grew by 274% in a single year: from 17,465 to 65,289 tonnes. Low-price Chinese chicken is redefining the protein map across the continent.
nnnnnChina’s exports have focused primarily on developing countries.
n
| Chinese poultry meat exports – Key markets (MT) | ||||||||
| Country | Rk | 2020 | 2021 | 2022 | 2023 | 2024 | 2025 | %Δ 24/25 |
| WORLD | 388,018 | 456,718 | 532,266 | 554,118 | 769,980 | 1,084,727 | 41 | |
| Africa (total) | 1,383 | 1,363 | 3,309 | 4,225 | 17,465 | 65,289 | 274 | |
| Japan | 1 | 161,196 | 180,098 | 193,109 | 172,371 | 185,400 | 201,465 | 9 |
| Hong Kong | 2 | 142,879 | 162,953 | 168,879 | 166,925 | 182,334 | 192,008 | 5 |
| Russia | 3 | 0 | 341 | 4,154 | 17,701 | 73,832 | 114,664 | 55 |
| EU 27 | 4 | 21,109 | 28,952 | 45,800 | 57,536 | 85,091 | 108,291 | 27 |
| United Kingdom | 5 | 6,144 | 8,352 | 18,442 | 25,432 | 37,548 | 49,995 | 33 |
| Cambodia | 6 | 2,379 | 3,256 | 5,292 | 7,067 | 10,595 | 42,249 | 299 |
| Kyrgyzstan | 7 | 0 | 193 | 3,555 | 10,922 | 24,595 | 40,300 | 64 |
| Malaysia | 8 | 13,172 | 16,904 | 22,535 | 11,430 | 23,572 | 35,017 | 49 |
| Mongolia | 9 | 13,120 | 14,179 | 19,252 | 25,917 | 32,939 | 34,494 | 5 |
| UAE | 10 | 705 | 874 | 1,906 | 2,496 | 10,314 | 33,569 | 225 |
| Georgia | 11 | 1,891 | 2,494 | 5,819 | 9,761 | 18,811 | 27,591 | 47 |
| Bahrain | 12 | 3,600 | 5,241 | 7,516 | 11,446 | 19,820 | 26,940 | 36 |
| Iraq | 13 | 0 | 0 | 271 | 251 | 2,903 | 25,859 | 791 |
| Philippines | 14 | 4,087 | 10,233 | 11,909 | 12,325 | 14,422 | 20,904 | 45 |
| Afghanistan | 15 | 2,508 | 3,998 | 6,870 | 4,532 | 13,642 | 19,394 | 42 |
| Macao | 16 | 11,712 | 12,981 | 13,506 | 15,035 | 16,434 | 16,619 | 1 |
| Libya | 17 | 0 | 0 | 28 | 0 | 2,569 | 16,014 | 523 |
| Angola | 18 | 9 | 0 | 274 | 220 | 3,653 | 14,461 | 296 |
| Qatar | 19 | 0 | 0 | 40 | 0 | 286 | 10,374 | 3,527 |
| Ghana | 20 | 13 | 106 | 1,218 | 1,506 | 3,733 | 8,330 | 123 |
| Source: China Customs Statistics / Trade Data Monitor | ||||||||
Change in product composition
nnnnChina’s export profile has shifted. In 2020, 58% of shipments were prepared/preserved products and 22% were frozen cuts. In 2025, frozen cuts account for 55% and prepared/preserved products for 38%. China has moved from exporting predominantly value-added processed products to Japan and Hong Kong, to selling basic frozen cuts at low prices to emerging markets.
nnnn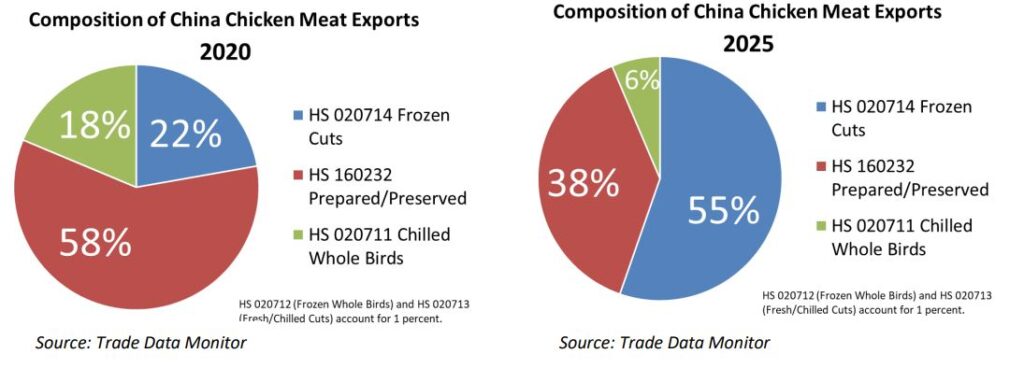
Composition of Chinese poultry meat exports: 2020 vs. 2025. Source: Trade Data Monitor.
nnnn«China needs to place its growing production surpluses. With a declining population and per capita chicken consumption of only 11 kg/year — compared to 55 kg in the U.S. — production growth far outpaces domestic demand.»
nnnnAccess restrictions that shape the strategy
nnnnThe report notes that, of the five largest import markets in the world, China has limited access to Japan, the United Kingdom, the EU and Saudi Arabia, and no access to Mexico. Its expansion will therefore focus on medium-sized and developing markets. If China’s export expansion exceeds the growth in global demand, it will have to displace direct competitors — adding further tension to the trade landscape.
nnnnMajor importers: Japan, United Kingdom, Mexico and the Philippines
nnnnJapan remains the leading importer with 1.13 million tonnes, slightly below 2024, with solid demand driven by convenience food consumption. The United Kingdom consolidates second place with 1.075 million tonnes. Mexico will import 1.05 million tonnes, somewhat less than forecast in December, affected by the new tariff-rate quota and domestic competition. The Philippines is the fastest-growing import market: from 496,000 tonnes in 2022 to a projected 710,000 tonnes in 2026, driven by the impact of ASF on local pig production.
nnnnThe HPAI factor: sanitary risk with trade implications
nnnnThe USDA report conditions several of its forecasts on the behaviour of highly pathogenic avian influenza (HPAI). EU production growth (+1%) assumes a reduction in outbreaks. U.S. exports remain penalised by restrictions in China and South Africa stemming from HPAI. And Brazil maintains its competitive advantage precisely because of its status as an HPAI-free country, an asset that protects its access to premium markets such as Japan, South Korea and Mexico.
nnnn«Brazil captures market share in markets where China cannot enter — Japan, Korea, Mexico — thanks to its product diversity, quality and, above all, its HPAI-free status.»
nnnnBeef and pork: summary of macro trends
nnnnBeef: Global production declining (-1%, 61.6 M t). Brazil remains the world’s leading producer despite a 2% fall. China is implementing tariff-rate quotas (TRQ) that will cut its imports by 13%. The U.S. is reducing production (-1%) and exports (-8%) due to a shortage of cattle and loss of access to China. Mexico is increasing production by 11% following the closure of the U.S. border to live cattle. Trade flows are being redistributed on a global scale.
nnnnPork: Global production +1% (120.2 M t). China dominates with 59.5 M t. Diseases (ASF) continue to shape trade: the EU is cutting exports by 8% due to the outbreak in Spain and lower margins. Brazil and the U.S. are gaining market share, redirecting flows towards Mexico, Central America and Asian markets affected by ASF (Philippines, South Korea, Taiwan). Chinese pork imports are falling by 16%: dependence on the Chinese market is now a thing of the past for Western exporters.
nnnnKey figures
nnnn| Key figures for the POULTRY MEAT sector at WORLD level – April 2026 | |
| World production 2026 (F) | 110.7 million tonnes RTC (+3%) |
| World exports 2026 (F) | 14.8 million tonnes (+3%) |
| Production leader | U.S. (22.2 M t) > China (17.3 M t) > Brazil (15.8 M t) > EU (12.3 M t) |
| Export leader | Brazil (5.15 M t, 35%) > EU (1.75 M t) > China (1.4 M t) > Thailand (1.275 M t) |
| Import leader | Japan (1.13 M t) > U.K. (1.075 M t) > Mexico (1.05 M t) > EU (0.76 M t) |
| Highest export growth | China: +41% in 2025, +29% forecast in 2026 |
| World consumption 2026 (F) | 107.5 million tonnes |
| Key sanitary factor | HPAI conditions market access and EU/U.S. forecasts |
| Source | USDA-FAS, Livestock and Poultry: World Markets and Trade, 9 April 2026 |
Source:
-. USDA Foreign Agricultural Service, Livestock and Poultry: World Markets and Trade, April 9, 2026. Data: Trade Data Monitor, China Customs Statistics.
nnnn
Tracking on NeXusAvicultura
nnnnThis report is part of the series of analyses that NeXusAvicultura publishes on the poultry meat sector. You can find all our previous articles on the global poultry meat sector at https://nexusavicultura.com/tag/sector-carne/
nnnnnnnnTo learn more:
-. Poultry farming in Europe
-. Global poultry meat consumption
• Global chicken market: strong demand, export records and a war that complicates everything (Rabobank Q2 2026)
• 2026 overview of the European chicken market
• 2025 map of broiler production: key trends (Rabobank World Poultry Map)
• Countries will prioritise food sovereignty in 2026 over producing chicken for export
• Spain seals historic agreement with China to open its market to Spanish poultry meat
• Poultry meat sector – All NeXusAvicultura articles
nnnn
Do you want to stay one step ahead in poultry farming?
Subscribe for free to our eNewsletter and receive a weekly selection
of the best information to anticipate trends, stay up to date and grow as a poultry industry professional.
NeXusAvicultura : Vision, Criteria, Quality and Context.