
A snapshot of meat poultry farming in Europe: rising production, price pressures, and unrelenting HPAI
The latest European Commission report (19 February 2026) paints a picture of a sector growing in volume but operating under the combined pressure of energy costs, avian influenza, and a shifting trade landscape
By Federico Castelló | NeXusAvicultura | March 2026
The European Commission’s DG AGRI has published an updated report on the state of the EU poultry meat market, presented to the CMO GREX Committee on Animal Products on 19 February 2026. The document, which brings together data from Eurostat, Member State notifications, and international sources, provides the most up-to-date snapshot of the poultry meat sector in the European Union. What it reveals is a sector under creative tension: growing in volume, growing in demand, and rising in price, yet operating under the world’s strictest regulatory framework, with persistent health threats and a trade landscape (Mercosur, China, etc.) in full reconfiguration.
This analysis breaks down the report’s main findings and places them in the broader context of European poultry farming to provide useful insights for poultry farmers, veterinarians and technical specialists, integrator companies, analysts, and sector decision-makers.
European broiler approaching €293/100 kg: prices rise as the production map is reordered
1. PRODUCTION
EU-27 chicken production grows 1.8% but with enormous disparities
Between January and November 2025, poultry meat production in the EU-27 increased by 1.8% compared to the same period in 2024, according to Eurostat. This represents moderate but significant growth in a year marked by recurring outbreaks of highly pathogenic avian influenza (HPAI) and production costs that remain above historical averages.
However, the EU average conceals stark differences between Member States. Greece leads growth with a spectacular +15.3%, followed by Croatia (+11.8%), Slovenia (+10.2%), Bulgaria (+10.1%), Slovakia (+9.5%), and Spain (+4.6%).
At the other end of the scale, France — historically the EU’s largest poultry producer — recorded a decline of −4.6%, a figure that reflects the cumulative impact of HPAI on its duck and turkey sectors and the associated health restrictions. Malta (−2.6%), Poland (−1.2%), and Austria (−0.8%) also recorded volume losses.
The +1.8% average conceals opposite realities: Greece grows 15.3% while France, the historically largest producer, falls 4.6%. The geography of HPAI is redrawing Europe’s production map.
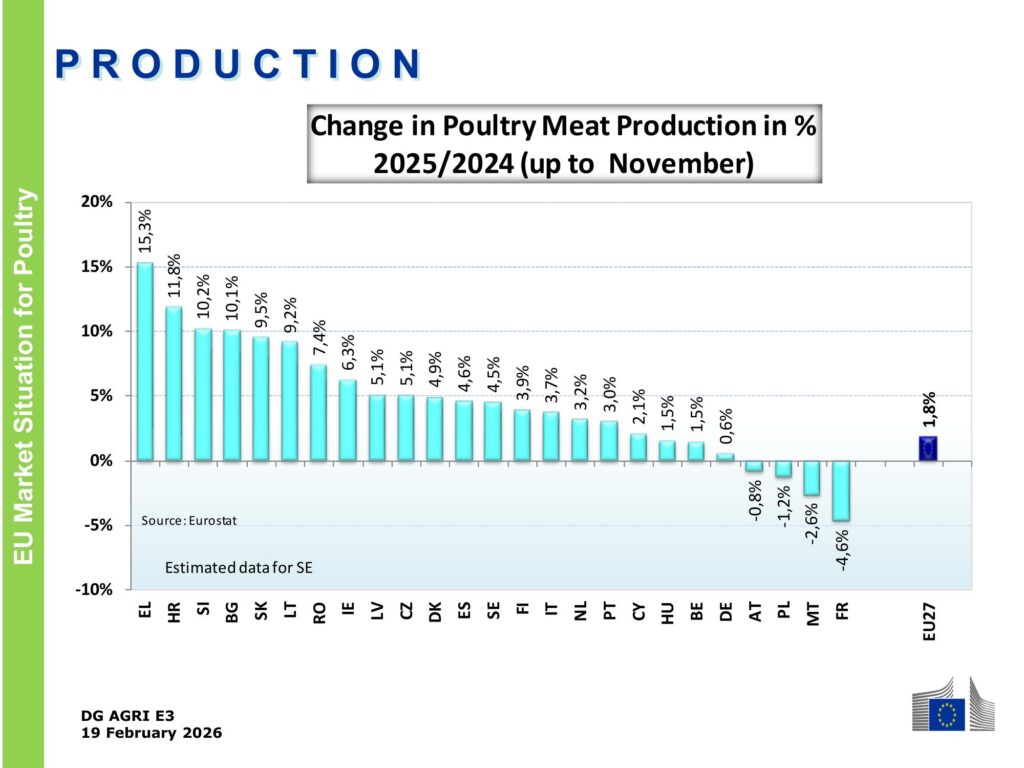
Source: Eurostat / DG AGRI E3. Change in poultry meat production by Member State, 2025 vs. 2024 (January–November).
The French figure deserves particular attention. Poultry farming in France has suffered recurring waves of HPAI since 2021, affecting in particular duck production in the southwest (Landes, Gers, Pyrénées-Atlantiques) and turkey farms in Brittany. France’s production decline is not merely cyclical: it reflects a structural difficulty in rebuilding flock numbers following mass depopulations, a problem Spain has also experienced, albeit on a smaller scale.
In absolute terms, the major producers remain Poland, Germany, France, Spain, Italy, and the Netherlands, although growth dynamics are shifting clearly towards the south and east of the continent.
2. PRICES
The spectacular rise in chicken prices in 2025 — the largest in history — is set to be maintained and may even increase in 2026
The average weekly EU broiler price stood at €292.86/100 kg in week 6 of 2026, representing an increase of +5% compared to the same period the previous year. This level remains clearly above both the 2024 average and the five-year average for 2021–2025.
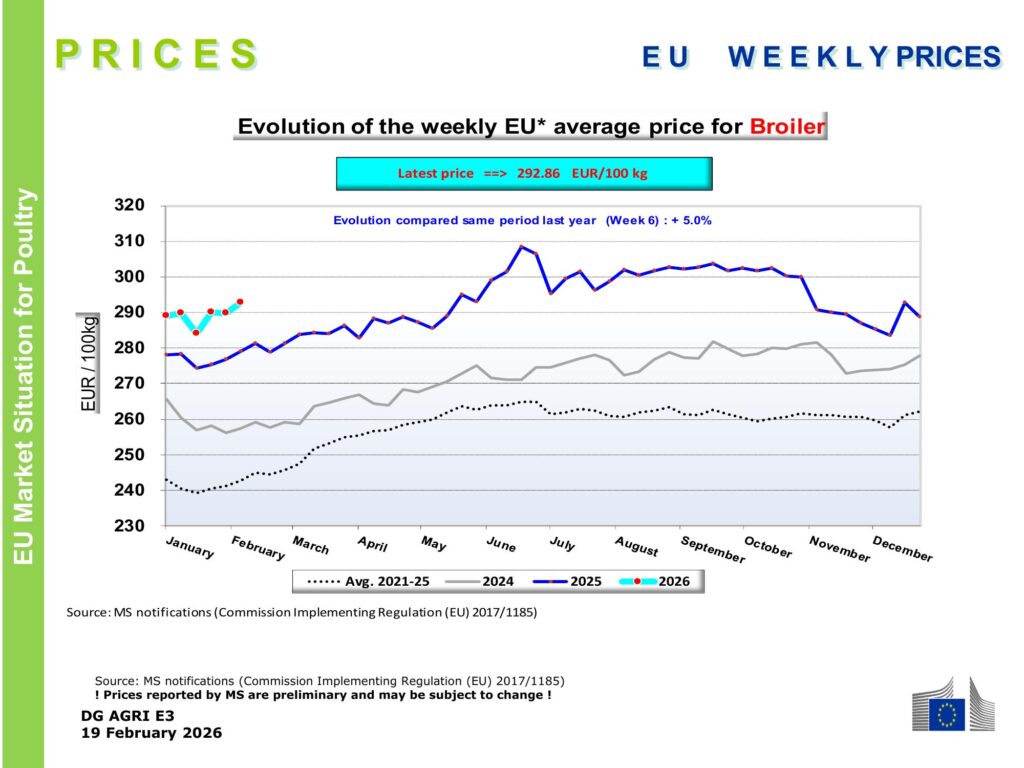
Source: Member State notifications / DG AGRI E3. Weekly average EU broiler price trend.
At €292.86/100 kg, the European broiler is trading 5% above 2025 levels and well above the five-year average.
Margins are improving, but structural costs are dampening any cause for euphoria.
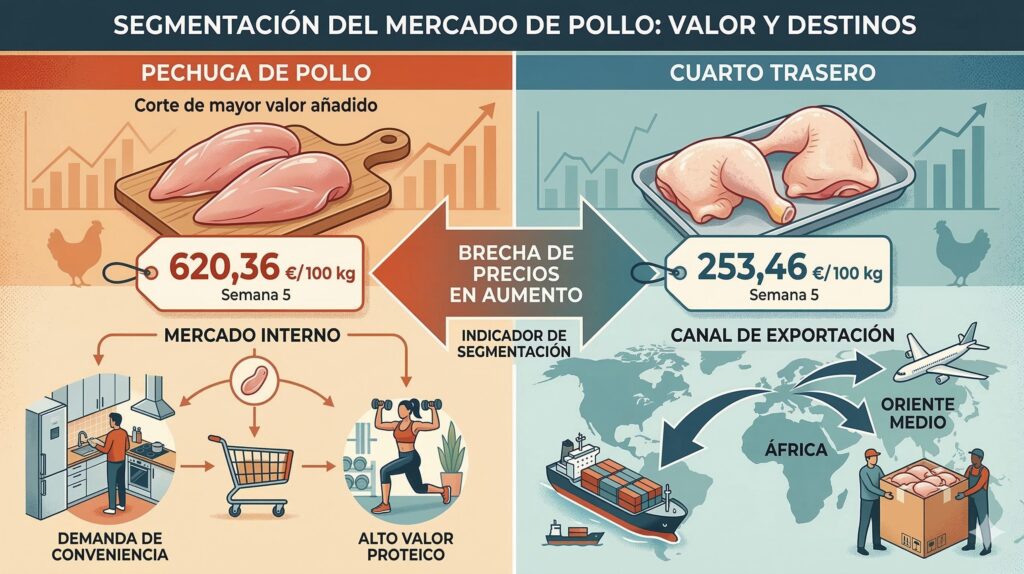
Chicken breast, the highest value-added cut, was trading in the EU-27 at €620.36/100 kg in week 5, while leg quarters stood at €253.46/100 kg. The gap between breast and leg quarters continues to widen, an indicator of the increasing segmentation of the market: breast meat responds to domestic demand for convenience and high protein content, while leg quarters feed the export channel to Africa and the Middle East.
3. COSTS
Production costs: partial relief, persistent pressure
The Commission’s cost chart shows a revealing trend. Following the cost peak of 2022–2023, driven by the energy crisis and rising feed costs (cereals and protein), direct costs moderated throughout 2024 and 2025. Feed costs, which represent the largest component, have fallen thanks to good cereal harvests and the normalisation of soybean meal prices.
However, the farm-gate broiler price, which had risen in parallel with costs, began to decline slightly in the final months of 2025 and early 2026 (it should be noted that this article and the report were prepared before the Iran war that began on 28 February 2026), while “other” costs (energy, machinery, labour, contracts) remain elevated. The result is a margin compression that producers know all too well: prices rise in “turbo mode” (by elevator) and come down “piano piano” (by the stairs), while costs only ever climb in “turbo mode”.
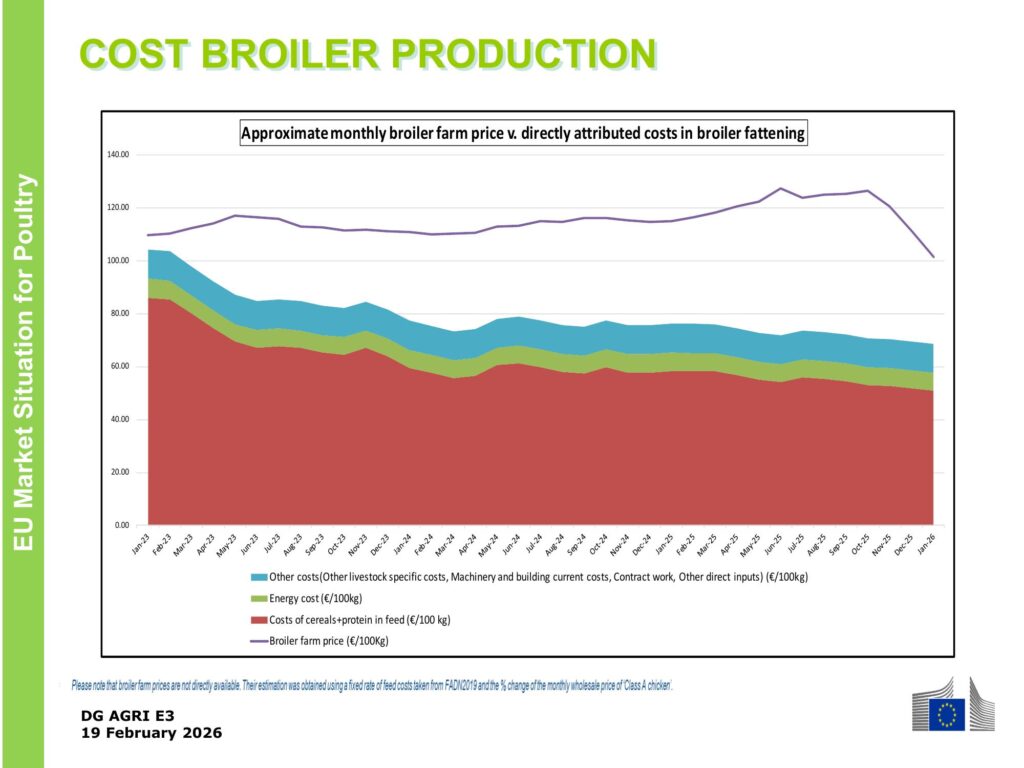
Source: FADN/DG AGRI E3. Approximate monthly farm-gate broiler price versus direct rearing costs.
Feed costs are moderating, but energy and operational costs remain elevated. The European producer’s margin remains vulnerable to any external shock (we will need to take into account the as yet unquantified effects of the Iran war that began on 28 February 2026).
4. THE HPAI THREAT
Highly pathogenic avian influenza: broilers accounted for only 11.3% of outbreaks and 15.12% of birds affected (out of a total of 573 outbreaks and 20.6 million farmed birds culled)
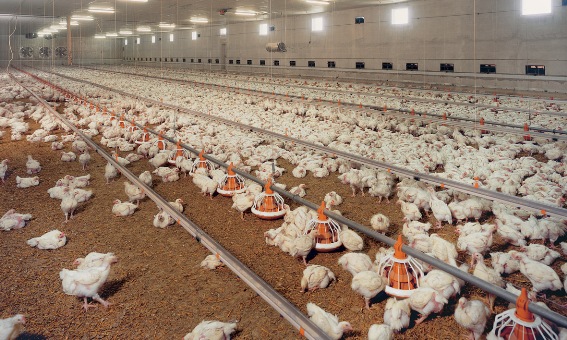
Certain MEPs and some of the more extreme advocates (?) of animal welfare who push for the long-term removal of chickens from the current closed-house farming model would do well to look at the HPAI outbreak statistics for broiler farms in the EU-27: only 11.7% of total outbreaks occurred on broiler farms — the indoor rearing model must have something to do with that…
The data are clear: between 1 October 2025 and 11 February 2026, the EU recorded 573 HPAI outbreaks in poultry holdings, with 20,564,329 birds affected. These figures confirm that HPAI has become an endemic risk in European poultry farming, with seasonal waves coinciding with wild bird migration routes.
Germany leads in number of outbreaks (187, or 32.6% of the total), but Poland accounts for the highest number of birds affected (5.78 million, or 28.1%), followed by Italy (3.18 million), Germany itself (2.53 million), and Spain (2.02 million with only 10 outbreaks in the period covered by the EC report, and 2.9 million farmed birds culled in total in 2025, indicating outbreaks on large-scale holdings). France, despite its production decline, remains the second country by number of outbreaks (116), while the Netherlands (35 outbreaks, 1.9 million birds) and Belgium (20 outbreaks, 1.06 million birds) complete the HPAI map in western Europe.
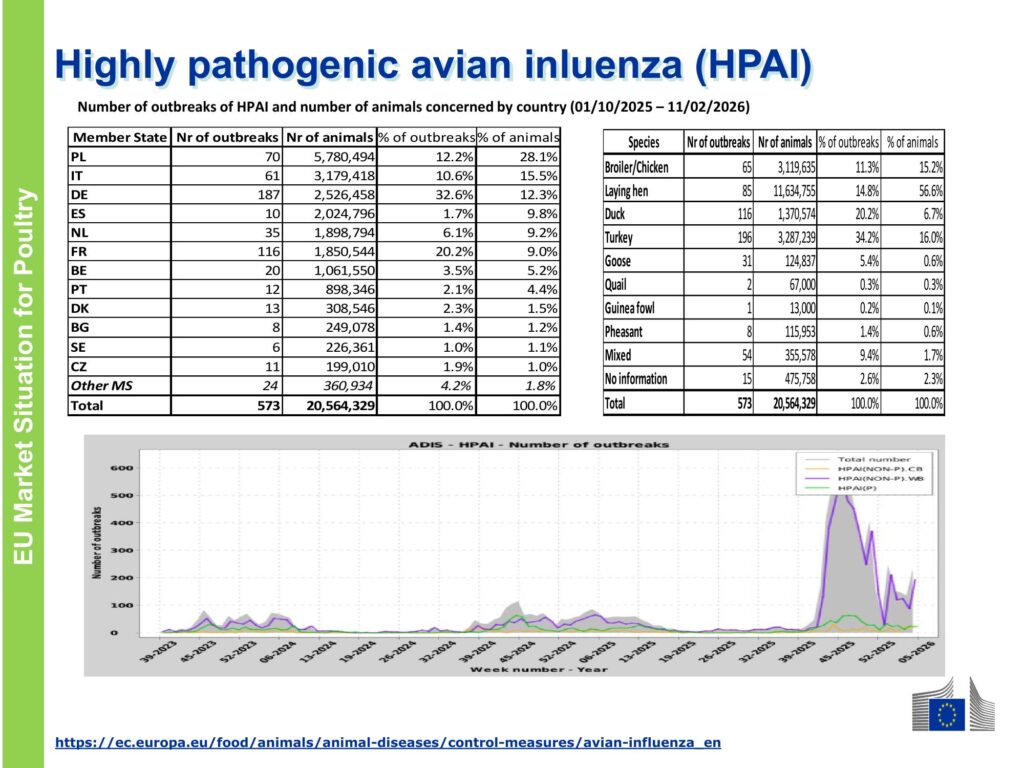
Source: ADIS / DG AGRI E3. Number of HPAI outbreaks and birds affected by country and species (1 Oct 2025 – 11 Feb 2026).
nnnnBy species, laying hens are by far the most affected: 85 outbreaks resulting in the culling or death of 11.63 million birds, 56.6% of the total animals affected. Turkeys rank second (196 outbreaks, 3.29 million birds), followed by broilers (65 outbreaks, 3.12 million) and ducks (116 outbreaks, 1.37 million).
nnnnWith 20.6 million birds affected in just over four months, HPAI is no longer an isolated crisis but an endemic risk that demands a rethink of biosecurity, production density, and a commitment to geographical diversification over the concentration of European poultry farming.
nnnnThe disproportionate impact on laying hens has direct implications for the European egg market — a segment that, as we have analysed, see the Warburg Pincus–Global Eggs deal as an example, is in full consolidation and investment phase. The pressure on egg supply in the EU, aggravated by HPAI, partly explains the appeal that the laying sector has acquired for international capital, and will be the subject of another specific “Sector X-ray” on eggs that we are preparing at NeXusAvicultura.
nnnnnnnnnnnn5- POULTRY TRADE (Opportunities and threats)
nnnnForeign trade: the EU exports less volume but earns more
nnnnExtra-EU exports of poultry meat reached 1,772,868 tonnes (carcass weight) between January and October 2025, a slight drop of −1.1% in volume compared to the same period in 2024. But turnover grew by +9.8% to €4,491 million. In other words, the EU is selling fewer kilos but at a higher price — a trend that reflects both rising domestic prices and a shift towards higher-value cuts and markets with greater purchasing power.
nnnn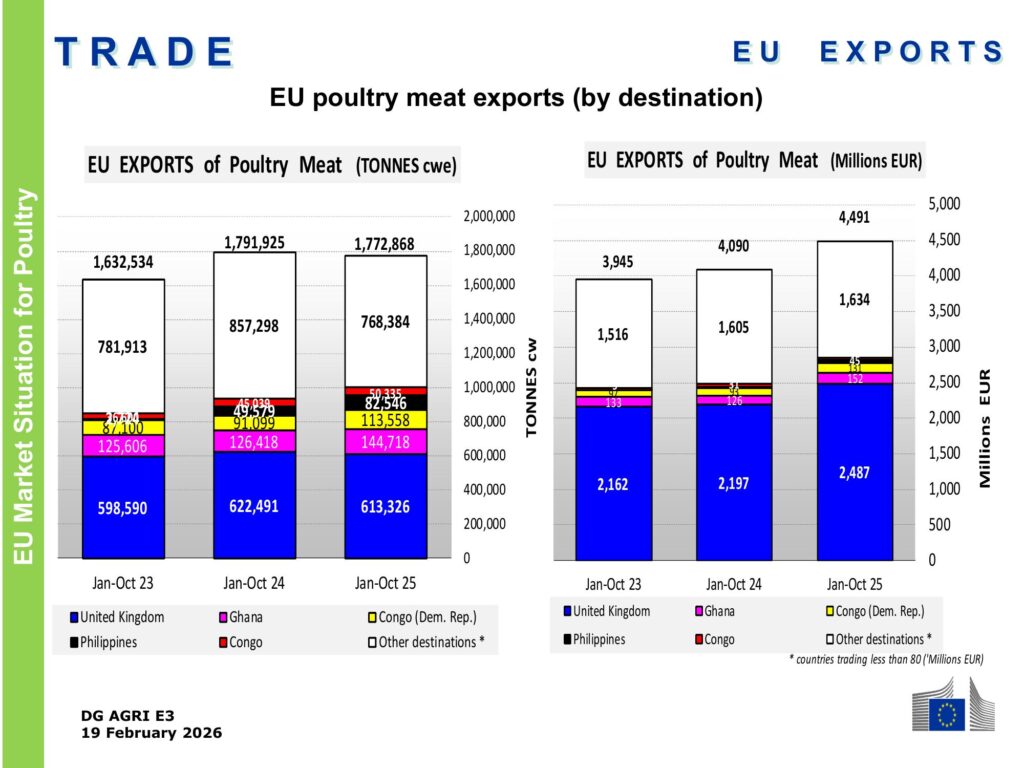
Source: Eurostat / DG AGRI E3. EU poultry meat exports by destination (volume and value, January–October).
nnnnThe United Kingdom remains the main destination with 613,326 tonnes (34.6% of the total), although it falls −1.5% in volume. Ghana and the Democratic Republic of the Congo, classic destinations for frozen leg quarters, grow by +14.5% and +24.7% respectively. The Philippines records the highest relative growth (+66.5%), while Saudi Arabia falls by −13.7%, a movement that could be linked to growing Brazilian and Thai competition in the Persian Gulf.
nnnnIn terms of value, the United Kingdom accounts for 62.6% of the EU’s export turnover, a notable trade dependency that Brexit has not substantially altered. Switzerland, with 6.1% of total value, confirms its position as a premium market for European poultry meat.
nnnnImports: Brazil falls, Thailand and China advance strongly
nnnnExtra-EU imports of poultry meat totalled 756,329 tonnes in January–October 2025, up +1.1% on the same period in 2024. But the value figure is far more telling: import turnover grew by +16.7% to €2,116 million, indicating a significant rise in the unit cost of imports.
nnnn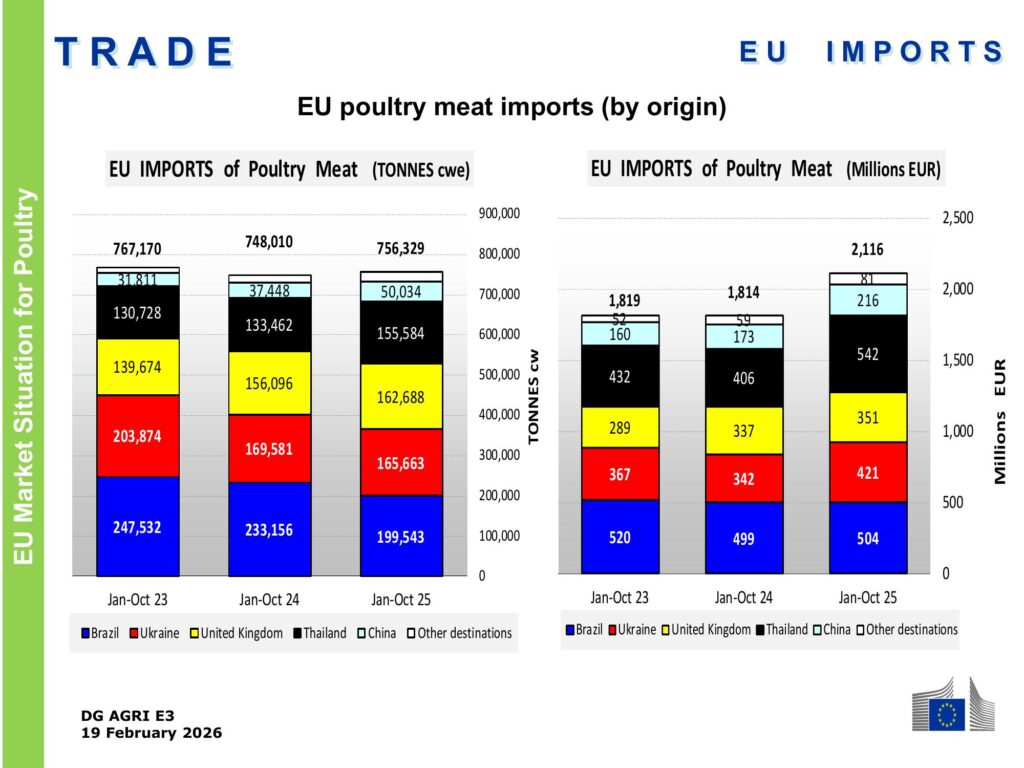
Source: Eurostat / DG AGRI E3. EU poultry meat imports by origin (volume and value, January–October).
nnnnBrazil, historically the largest extra-EU supplier, falls −14.4% in volume (199,543 t), although it practically maintains its turnover (+1.0%), suggesting a shift towards higher-value cuts. Ukraine holds its second position with 165,663 t (−2.3%), followed by the United Kingdom (162,688 t, +4.2%).
nnnnThe most striking movements are in Asia: Thailand grows +16.6% in volume to 155,584 t, consolidating its position as the fourth supplier, and China advances +33.6% to 50,034 t. Argentina, from a small base, surges its shipments by +72.5%. These figures reflect the growing diversification of the EU’s import origins, a trend of particular relevance in the context of the debate over the EU-Mercosur agreement and the opposition of European poultry integrators to tariff liberalisation.
nnnnBrazil loses volume share but maintains value; Thailand and China advance strongly. The EU’s import map is diversifying, and the EU-Mercosur debate will add another layer of complexity to the trade landscape.
nnnnTrade balance: the EU remains a net exporter, but the gap is narrowing
nnnnThe EU maintains a positive trade balance in both volume and value. In the cumulative January–October 2025 period, exports exceed imports by more than one million tonnes and by approximately €2,375 million. However, the trend shows a gradual compression: imports are growing faster in value than exports, driven by processed shipments from Thailand and Ukrainian salted breast meat entering at zero tariff since 2022.
nnnn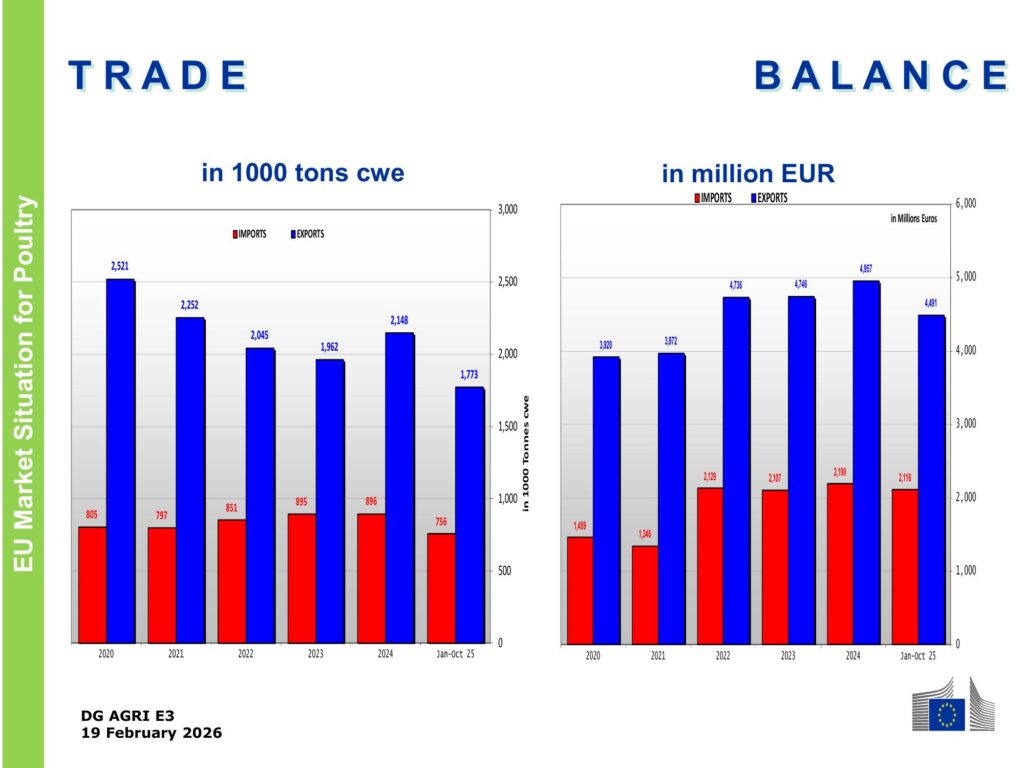
Source: Eurostat / DG AGRI E3. EU poultry meat trade balance (volume and value, 2020–2025).
nnnnThis last point is particularly relevant. Imports of poultry products from Ukraine are concentrated in the Netherlands (which acts as an entry point and redistribution hub) and Austria, and have generated political tension in several Member States. The report includes a detailed monthly breakdown (page 16) showing how Ukrainian shipments have remained stable throughout 2025, with an annual total of 186,816 tonnes, following the peak of 231,323 t in 2023.
nnnnInternational context: EU broiler costs are 2.6 times higher than Brazilian ones.
nnnnThe report includes a price comparison of broilers across three major blocs: the EU (€292.86/100 kg), the United States (€220.56/100 kg) and Brazil (€113.37/100 kg). The cost gap is evident and structural: the European broiler costs 2.6 times more than the Brazilian one in market price terms.
nnnn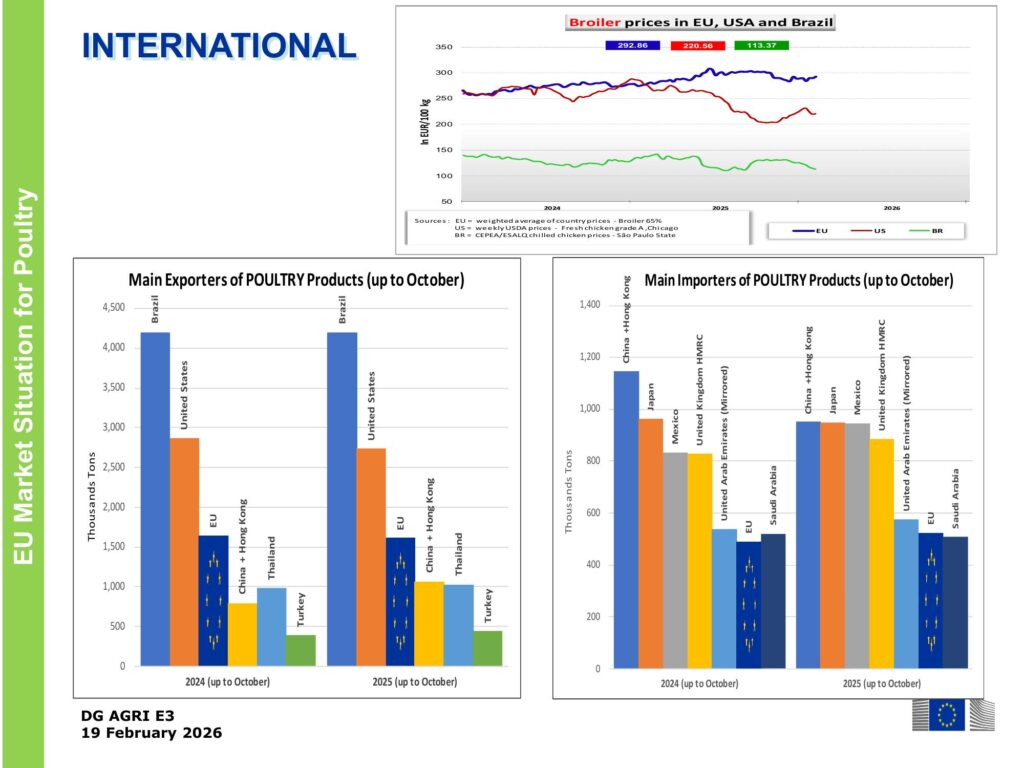
Source: DG AGRI E3 / USDA / CEPEA-ESALQ. Broiler prices in the EU, USA and Brazil, and main world exporters and importers of poultry products.
nnnnnnnnThis difference is explained by the higher costs of feed, energy, labour, animal welfare and regulatory compliance in the EU. But also by scale: Brazil operates with vertical integrations of millions of birds and an agro-industrial complex optimised for export, while European production remains comparatively more fragmented.
nnnnIn the ranking of world exporters, Brazil clearly maintains the lead, followed by the United States. The EU is in third position, ahead of China+Hong Kong and Thailand. Among importers, China+Hong Kong, Japan and Mexico lead global demand.
nnnnnnnnnnnn6- KEY FIGURES AND TRENDS
nnnnnnnnKEY FIGURES FOR THE EUROPEAN BROILER POULTRY SECTOR
nnnn| Source | European Commission – DG AGRI E3, CMO GREX on Animal Products |
| Report date | 19 February 2026 |
| EU-27 production (Jan–Nov 2025) | +1.8% year-on-year |
| Average EU broiler price (week 6/2026) | €292.86/100 kg (+5.0% year-on-year) |
| EU chicken breast (week 5) | €620.36/100 kg |
| HPAI outbreaks (Oct 2025 – Feb 2026) | 573 outbreaks | 20.6 million birds affected |
| Extra-EU exports (Jan–Oct 2025) | 1.77 M t (−1.1% vol.) | €4,491 M (+9.8% value) |
| Extra-EU imports (Jan–Oct 2025) | 756,329 t (+1.1%) | €2,116 M (+16.7%) | Notable: chicken imports from China to Europe have grown by 33% and it is now the fifth largest exporter to the EU |
| Main world exporters | Brazil, USA, EU, China+HK, Thailand |
| Comparative prices (Feb 2026) | EU: 292.86 | USA: 220.56 | Brazil: 113.37 €/100kg |
Conclusions and key takeaways for the sector
nnnnThe Commission’s report of 19 February 2026 leaves several key conclusions for any professional linked to the European broiler poultry sector:
nnnnProduction is growing, but unevenly. The EU-27’s +1.8% conceals the decline in France and Poland and the rise of Greece, Croatia, Spain and eastern European countries. HPAI is redistributing European productive geography.
nnnnPrices remain high but under pressure. At nearly €293/100 kg, the European broiler offers acceptable margins, but the moderation (pending the effects of the Iran War) in feed costs does not offset the persistence of energy and operational costs.
nnnnHPAI is already an endemic risk. 573 outbreaks and 20.6 million birds in four months demand that biosecurity, epidemiological surveillance, and eventually AI vaccination in production poultry be placed at the centre of the sector’s strategy against an avian influenza that is here to stay.
nnnnForeign trade is rebalancing. The EU exports lower volumes but earns more revenue, and imports are diversifying towards Thailand, China, and Argentina. The EU-Mercosur debate and the Ukrainian flow add layers of complexity.
nnnnCompetitiveness against Brazil remains the great challenge. With a price differential of 2.6x, European poultry competes on quality, traceability, and animal welfare, not on cost. Protecting that value differential, defending the European production model, and demanding consistency from the EC, in the face of import pressure, is the strategic task of the coming decade.
nnnnFederico Castelló
Founder of NeXusAvicultura.com
nnnn
Sources:
-. Information on European poultry published by NeXusAvicultura
-. “Market Situation for Poultry“, CMO GREX on Animal Products, 19 February 2026. Data: Eurostat, notifications from Member States (Commission Implementing Regulation (EU) 2017/1185), ADIS (Animal Disease Information System), USDA, CEPEA/ESALQ. Charts: extracted directly from the original European Commission report (CC BY 4.0).
nnnnnnnn
Want to stay one step ahead in poultry?
Subscribe free to our eNewsletter and receive a weekly selection
of the best information to anticipate trends, stay up to date, and grow as a poultry industry professional.
NeXusAvicultura: Vision, Insight, Quality and Context.